Forget what you hear on CNBC or Bloomberg.
It’s the options market that drives the $SPX price action.
Options became the new underlying and $SPX - the derivative.
Understanding the impact of options flows is vital if you trade the $SPX.
Let’s have a look at how they work!
This article is also available as a Twitter thread:
Meet Gary.
Gary is a market maker.
His job is to deal in $SPX options.
He makes it possible for hedge funds, pension funds, portfolio managers and other market players to trade their options against him.
He provides liquidity.
Oh, and he’s also a gorilla.

And a pretty big one as well - quite a massive chunk of $SPX options volume goes through him.
Once someone trades options with him, he can rarely make the same offsetting trade against someone else (after all, he’s not a broker).
It's great when it happens, but most of the time, he’s just left to sit on the risk and warehouse it on his books.
So, the first thing Gary does is to delta-hedge and remove the option's directional risk.
He hits SPX Index MDM<GO> on his Bloomberg and checks the orderbook.

And it looks fantastic!
Tight spread on the best bid/offer, lots of quotes in both directions and with good size too!
There’s some good market depth in there!
Gary likes what he sees.
All that liquidity means he’ll have no issues hedging delta in either direction.
It's good for business.
With delta hedging not an issue, Gary can afford to sell options cheaper and make more volume.
Equally, when buying options, he wouldn't pay for them more than he can recover from delta hedging them.
With so many quotes in the orderbook, it’s difficult for the index to make any meaningful moves.
And so, Gary remarks the whole vol surface lower.
It's often that implied volatility directly reflects the market liquidity.
As liquidity rises, implied volatility falls and vice versa:
- Liquidity is inadequate -> orderbook is thin -> easy to move the market -> higher realised vol -> higher implied vol
- Liquidity is abundant -> many orders in the orderbook -> hard to move the market -> low realized vol -> low implied vol.
And Gary likes his liquidity like he likes his bananas - the more he has, the better it is.
And on this quiet summer day, Gary’s got lots of bananas.

But even during the summer, all those big portfolio managers are keeping Gary very busy.
It's usually said that it’s either fear or greed that dominates the market at any one time.
But with portfolio managers, it seems that both of these emotions are dominant simultaneously.
Somehow, they manage to manifest themselves within a single individual.
As a result, Gary’s client order flow usually takes shape in the form of downside buying and upside selling.
Everyone wants protection, and at the same time - everyone wants to make some extra money where they can (in part to help pay for that same protection, as it ain't cheap)
As a result of this flow, there’s lots of demand for OTM puts and quite a bit of supply of OTM calls.
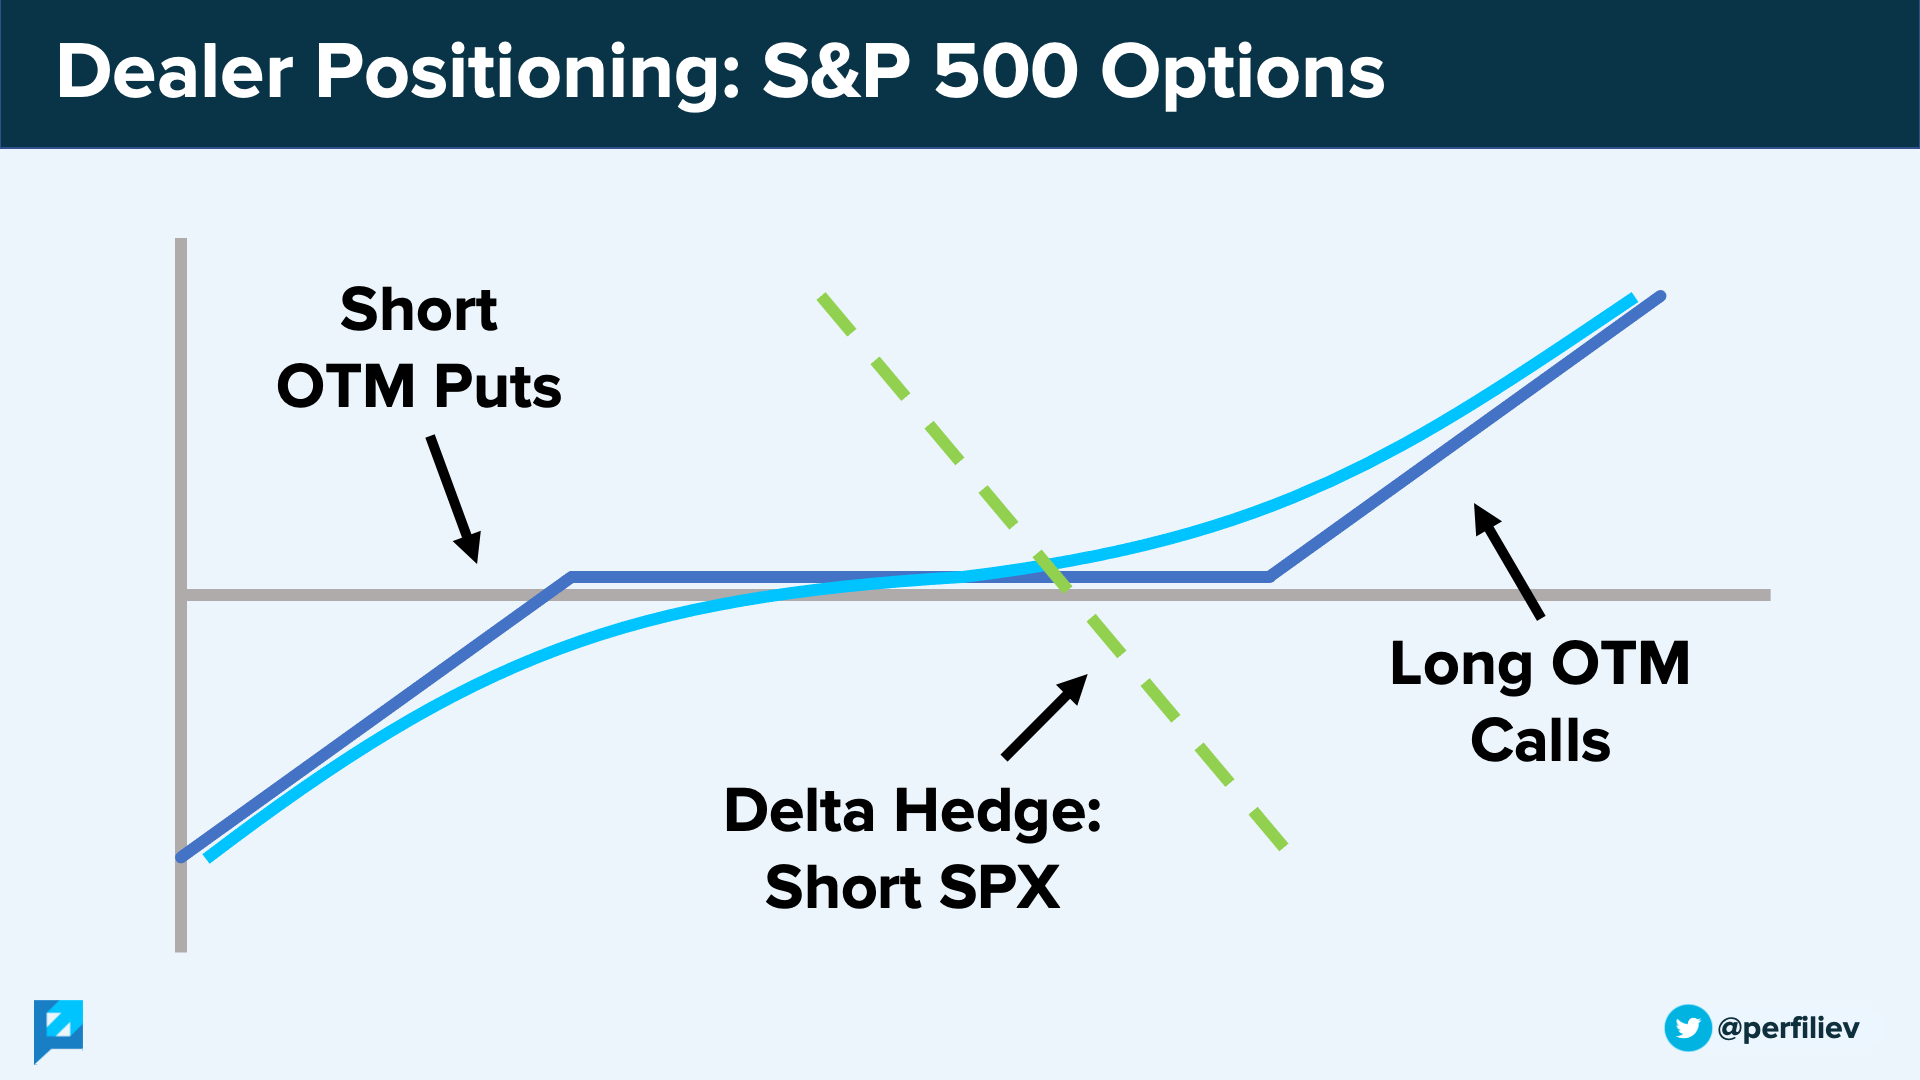
Consequently, Gary’s book is primarily short deep OTM puts and long OTM calls.
This, of course, needs to be delta hedged, which forces Gary to sell $SPX for both - the put side and the call side.
Thus, any positive delta from the options is offset by the negative delta from the short S&P position, resulting in an overall delta of zero.
After the book is hedged, Gary’s got a minute to grab a quick coffee and a croissant, but he’s not done.
What matters now is how the delta changes.
As it moves around, Gary will need to rebalance his delta hedge by trading in the underlying.
And this trading activity is not discretionary – he’s fully at the mercy of his delta!
In order to stay delta hedged, he must trade the $SPX as directed by his delta changes.
And keep in mind that Gary is a big gorilla.
He controls a significant portion of $SPX options flow.
His delta hedging activity is far from trivial.
The rebalancing flows are meaningful and frequently impact the underlying market.
Wouldn’t it be great to know in advance what these flows are going to be?
The size and direction of these flows depend on how much dealer’s delta wanders around.
And that in turn depends on:
- Changes in the underlying price.
- Changes in implied volatility.
- The passage of time.
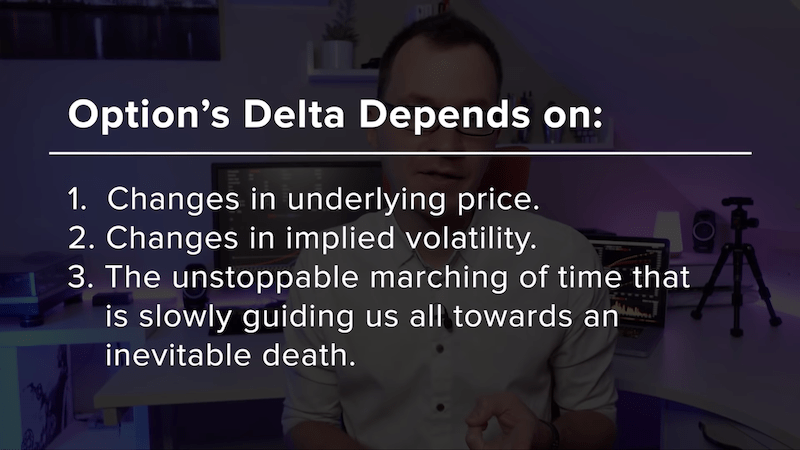
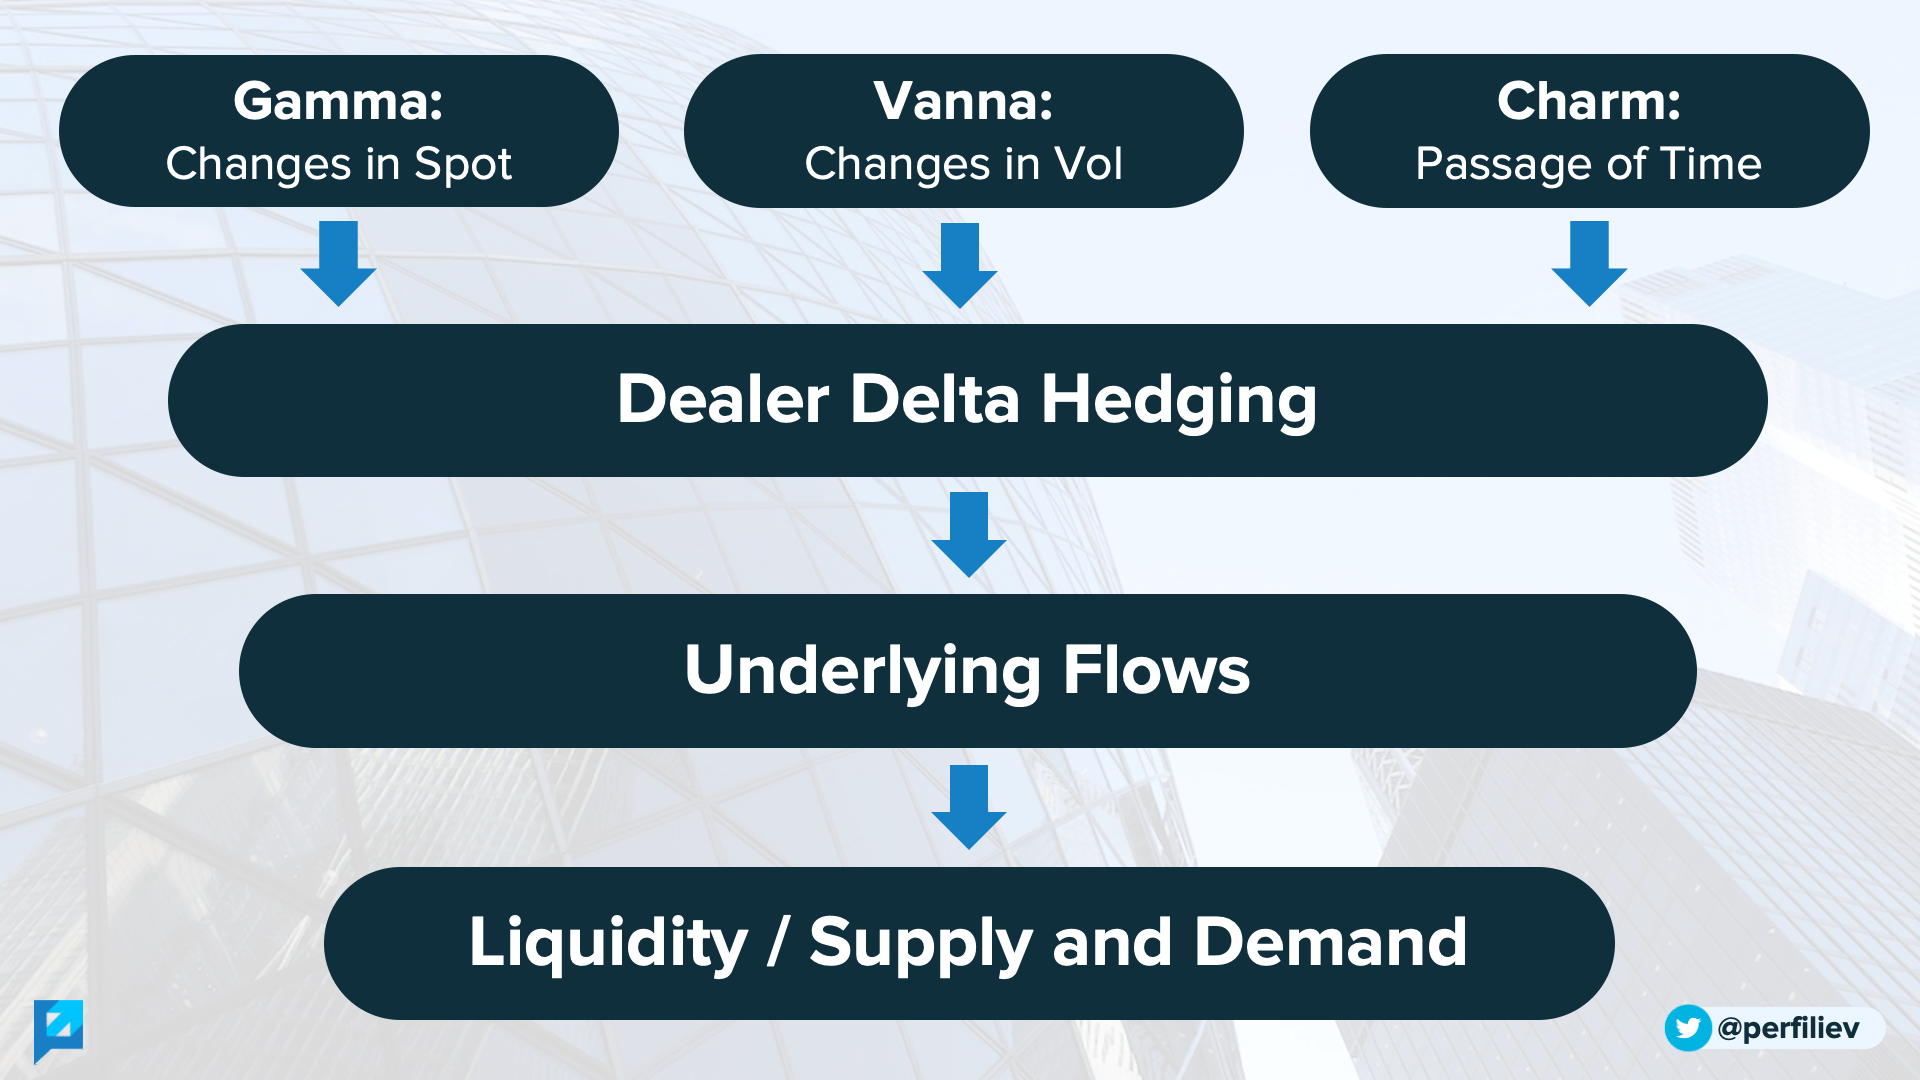
The effects of these quantities are measured by Gamma, Vanna and Charm.
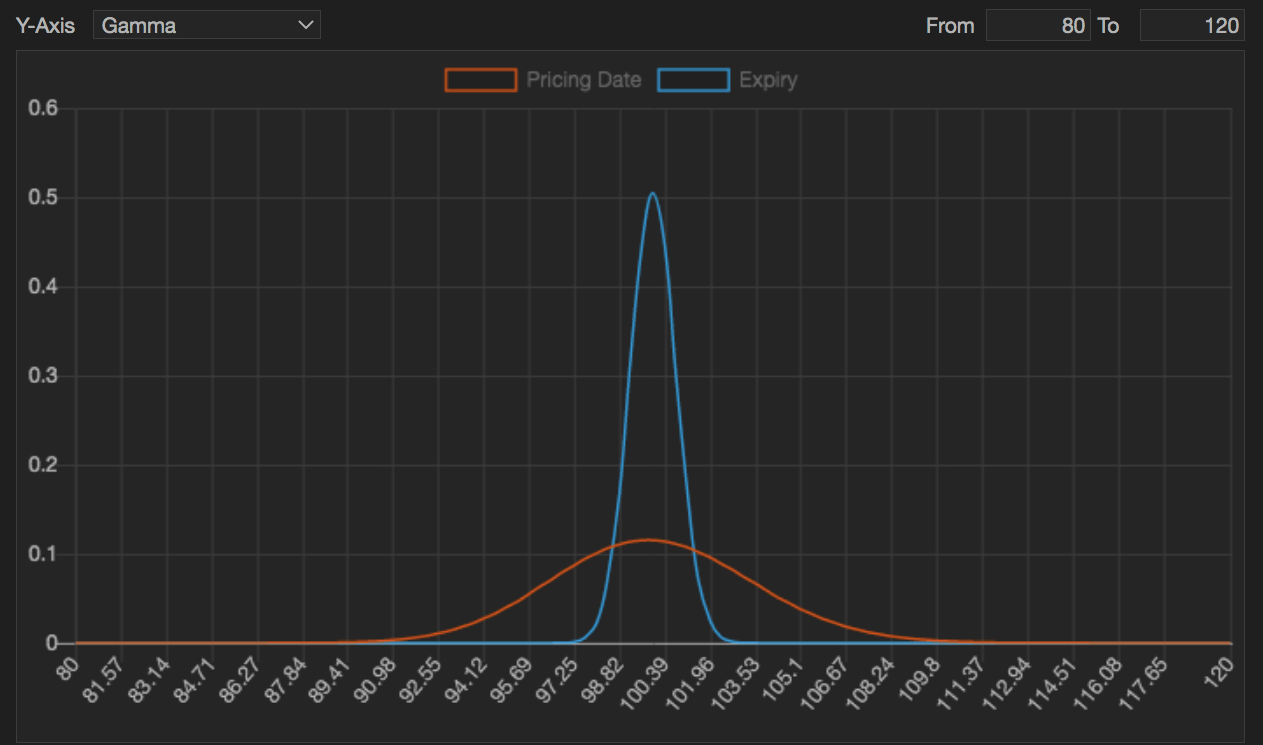
Gamma is the change in delta with respect to underlying price.
Vanna is the change in delta with respect to implied volatility.
Charm measures the change in delta with respect to the passage of time.
If it's a quiet summer day and the market has been slowly grinding higher, Gary finds himself sitting around the long OTM calls territory, where he’s long gamma.
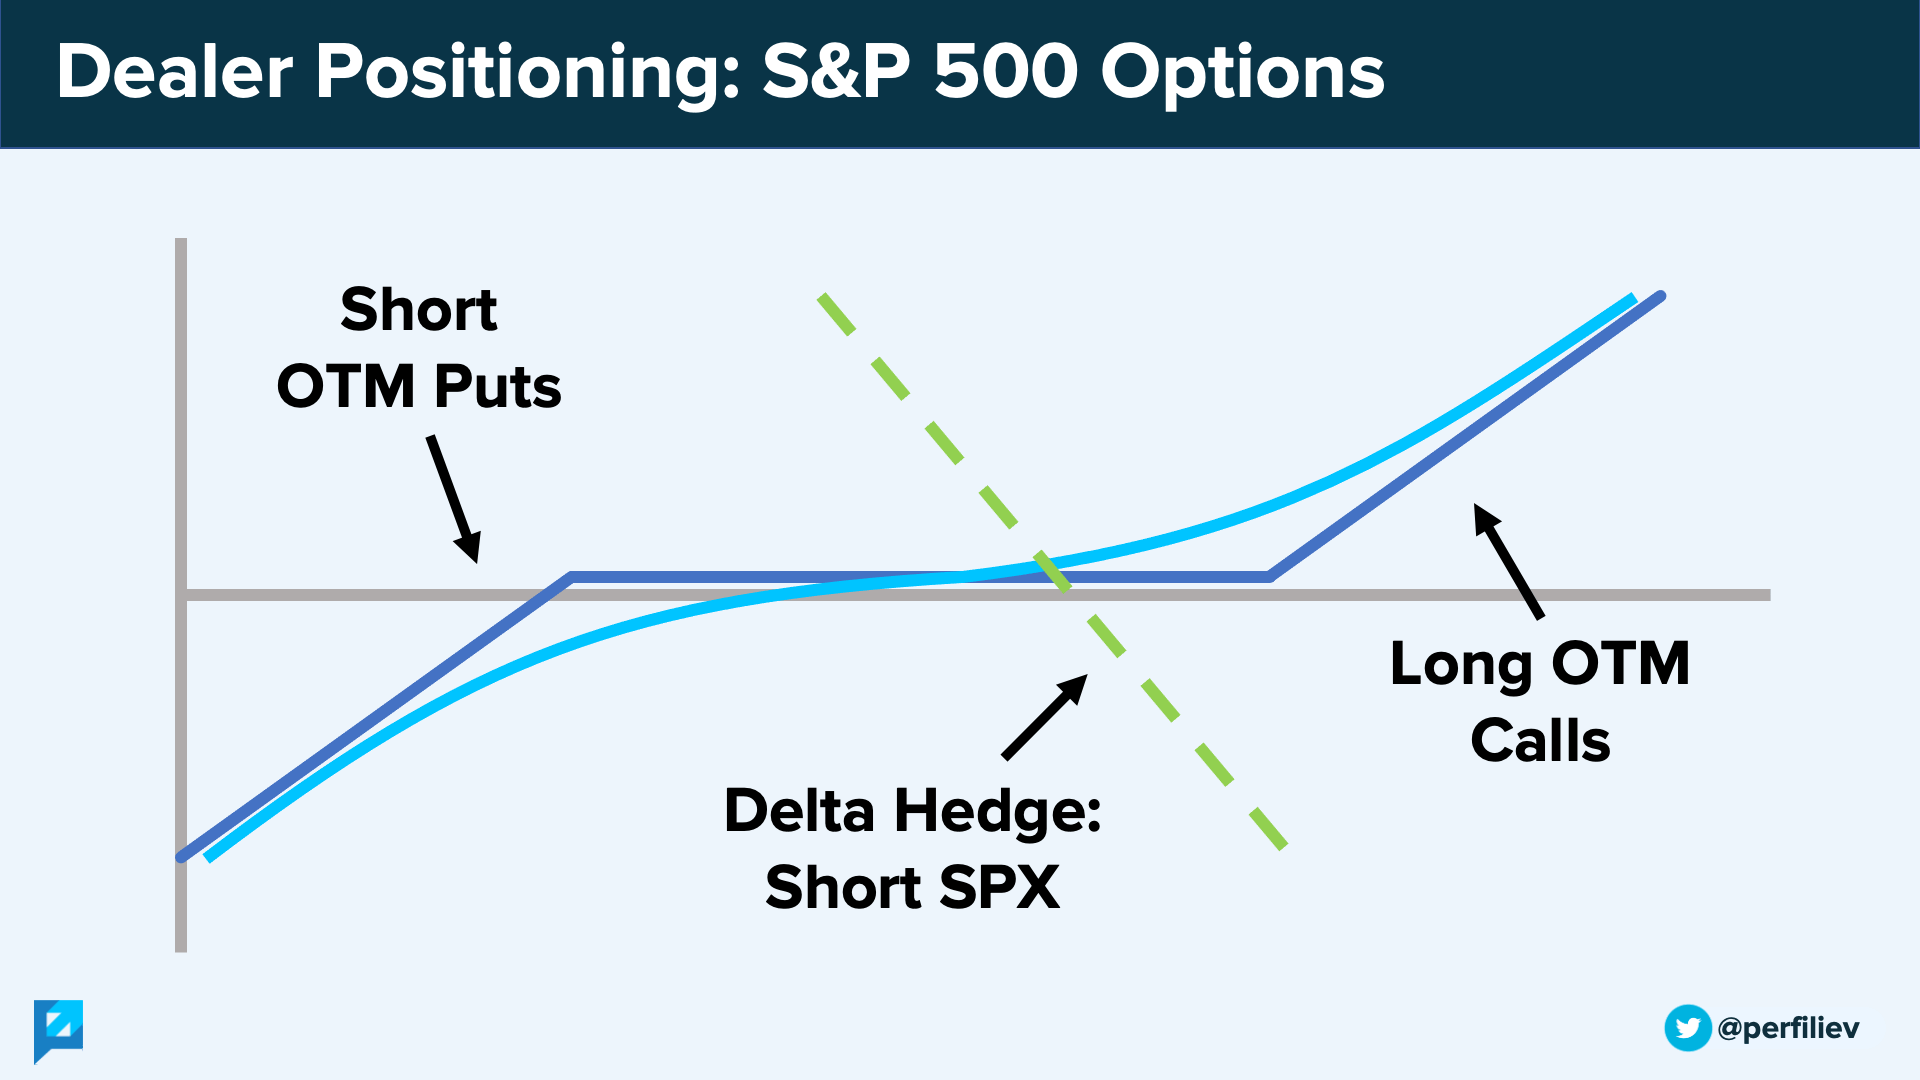
If index rises, his options delta will increase towards 1, as options become ATM/ITM, and he’ll need to sell $SPX to counter that.
If index falls, Gary’s options delta will decrease towards 0 as options get further OTM, and he'll need to buy back his $SPX shorts to offset this.
In case you want to play around with Gamma yourself, feel free to use any online Black-Scholes options calculator. Bump the underlying price and notice how the delta changes.
In summary, if the dealers are long gamma, they’re buying the dips and selling the rallies, which acts as a stabilizer for the index.
And if the long gamma exposure is significant (i.e. large open interest), it acts as a magnet and pins the index around a specific price range.
As you move towards Options Expiry (OpEx) week, the gamma for ATM options rises significantly and can further dampen the index moves.
Apart from Gamma's stabilizing flows, there are also Vanna and Charm flows.
For OTM options, delta moves towards zero as:
- Implied vol drops.
- The option approaches expiry.
Under normal market conditions, the implied volatility term structure is in contango and is upward sloping.
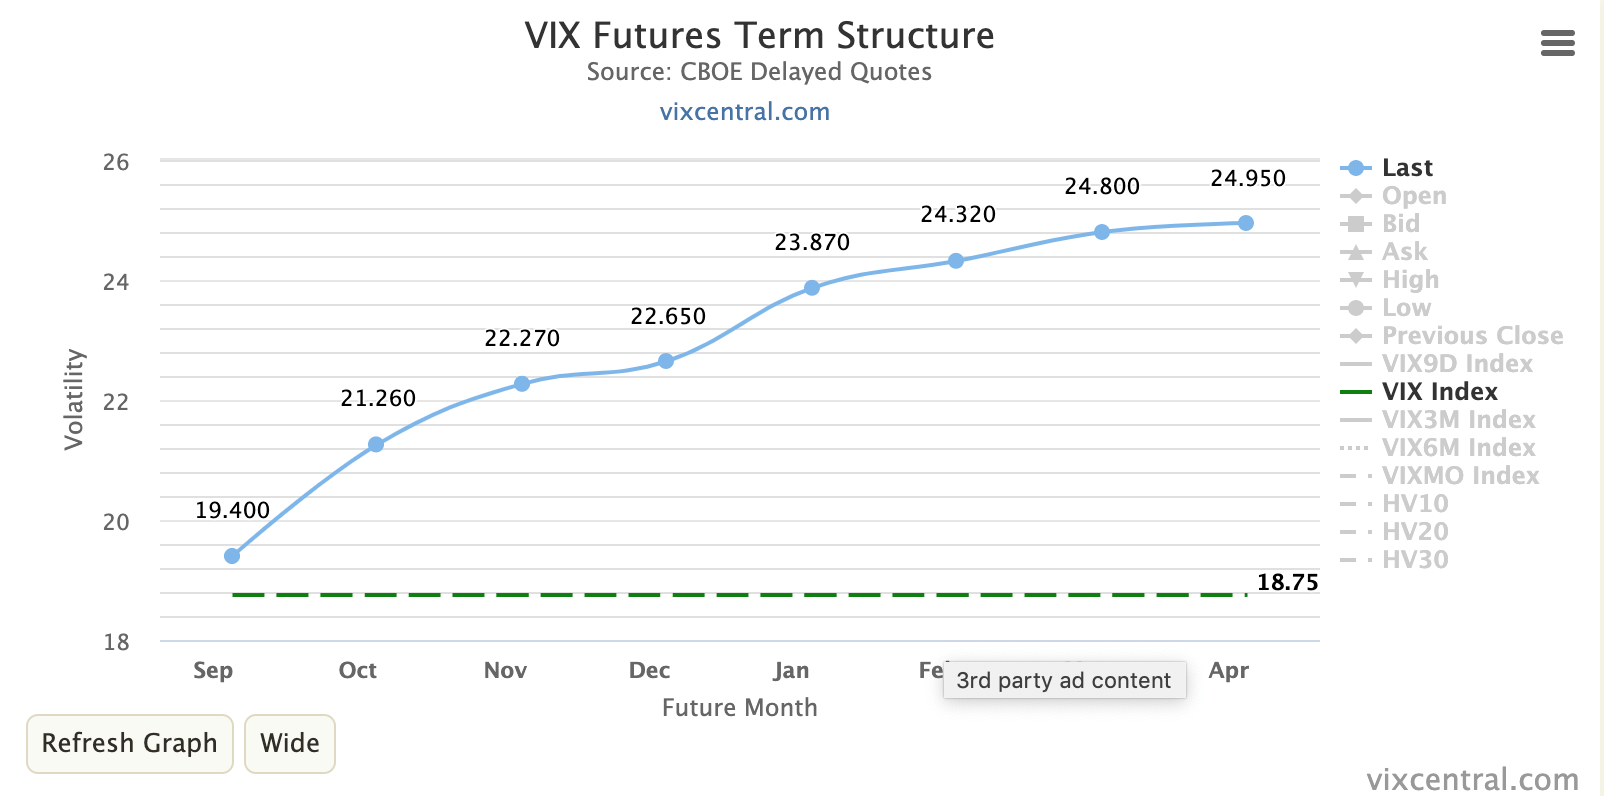
For an option not too far away from ATM, we expect its implied volatility to decrease as it approaches OpEx.
It would just roll down the term structure.
This change in implied volatility causes delta to decrease, as measured by Vanna.
But Vanna is not the only thing that decreases delta.
There's also Charm.
As we get closer to expiry, OTM options become cheaper, and deltas tend to zero.
Together with Vanna, Charm is guilty of lowering deltas as options approach their due date.
Since Gary’s positioning is mostly long OTM calls, a lower delta means he’ll need to rebalance his hedge and buy back some of his $SPX shorts.
Now, I say "some", but given the size of his $SPX options book, buying "some" $SPX can, in fact, result in quite significant index flows and move the index higher.
Especially in the run-up to OpEx.
The effects of Vanna and Charm are the strongest during the 2nd and 3rd week of the month - i.e. OpEx week and the week before.
These flows are frequently guiltily of a slow grind higher that we usually see in $SPX in the run-up to OpEx.
As we move towards the end of the OpEx week, the Vanna and Charm flows start fading away.
Part of these flows come off the table when we hit VIXpiration on Wednesday, making an opening for the window of weakness.
After the OpEx, Gamma, Vanna and Charm expire, and the index is free to do whatever it is that indices do when not subjected to option hedging flows.
This is when Vanna and Charm go on a holiday, and their flows aren't present to support the market.
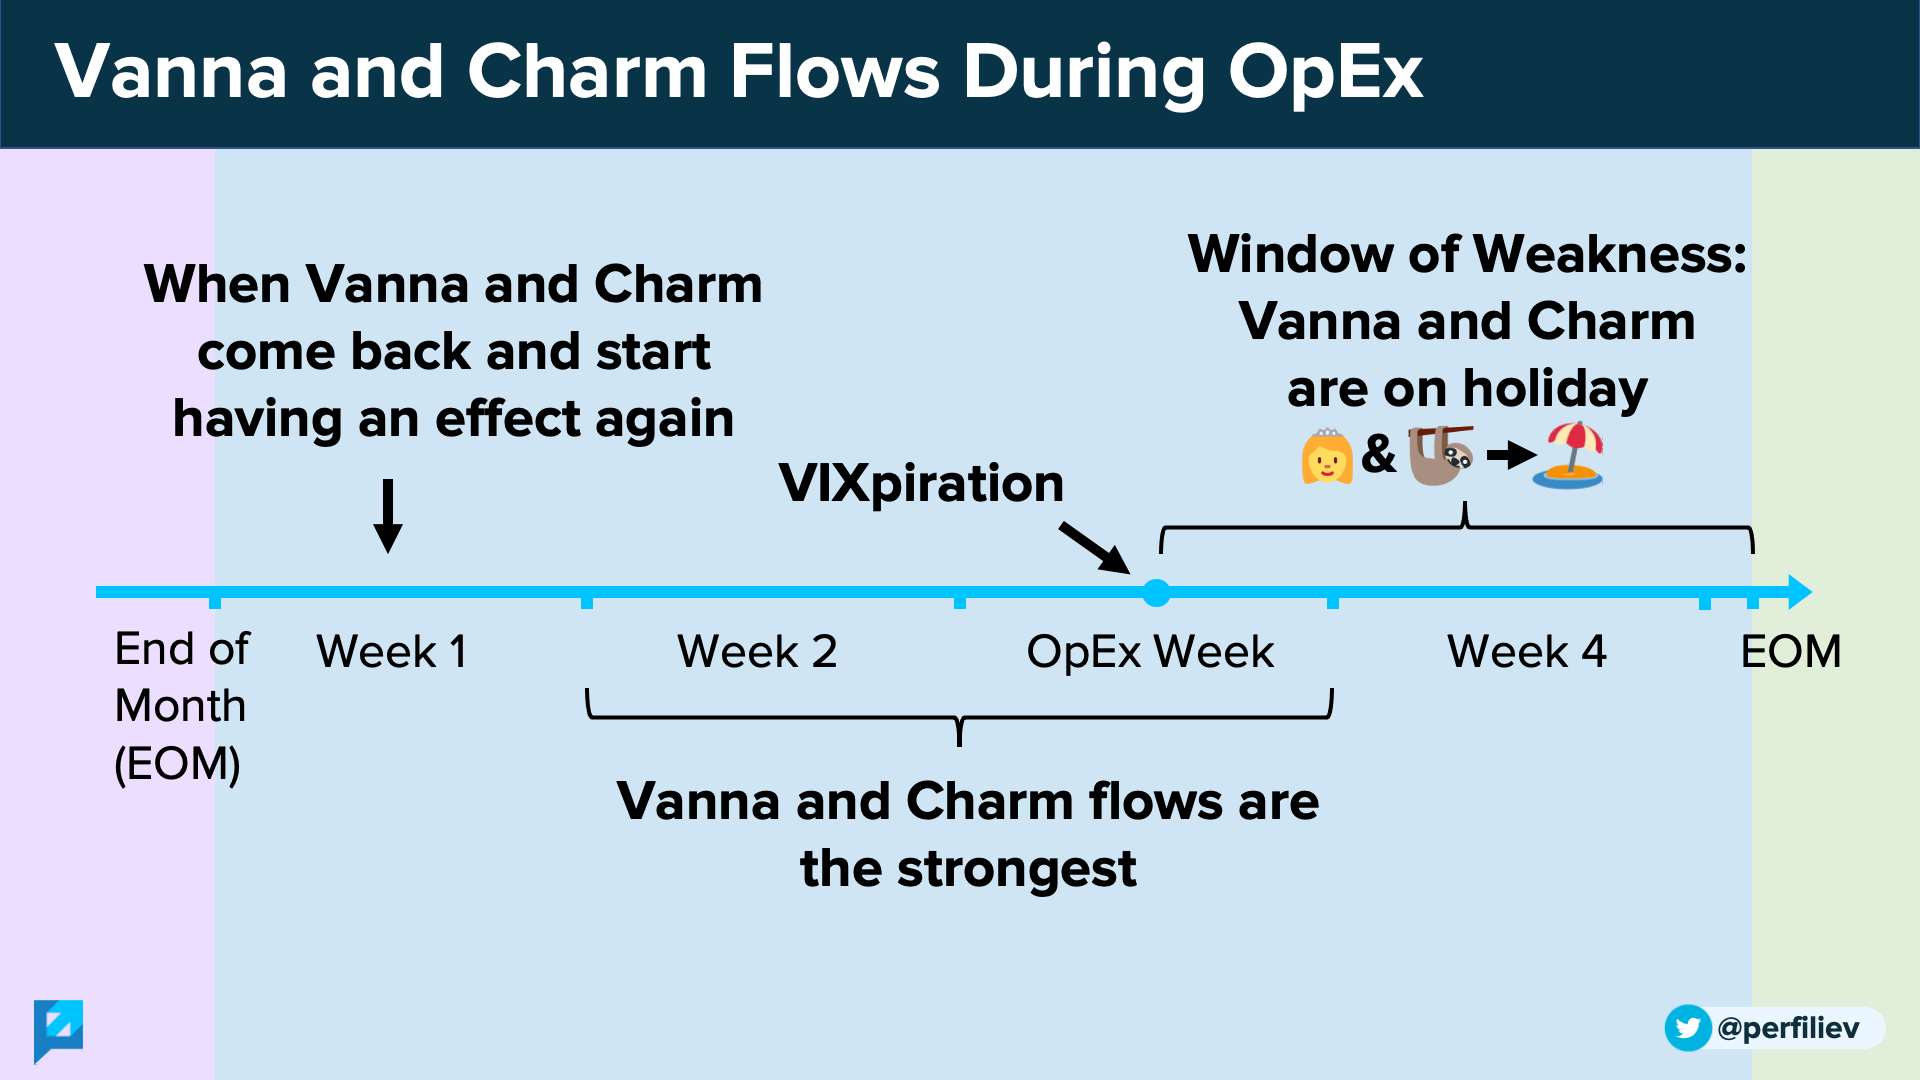
The window of weakness does not necessarily mean the index will crash.
It just means that it stopped flirting with Vanna and Charm and is open to other relationships.
Hence, it’s more susceptible to other market-moving stories during this time.
At around the end of the month, Vanna and Charm start coming back and begin having an effect again.
Of course, these dynamics aren’t an exact science.
They largely depend on dealer positioning, where the open interest is, what level the volatility is, and how much it is moving.
Nonetheless, understanding them can help explain some of the dynamics of $SPX that we see around OpEx.
Bounce.
— Carl Quintanilla (@carlquintanilla) August 23, 2021
Bounce.
Bounce.
Bounce.
What is it about the 18th/19th day of the month?
(h/t @NorthmanTrader) pic.twitter.com/BxJGrSKcyX
Thank you so much for taking the time to read this!
I sincerely hope you found it interesting and valuable.
Follow me on Twitter (https://twitter.com/perfiliev) for more educational threads around stocks, options and other topics within the incredible world of financial markets.


