TO ALL EQUITY PMs:
YOU MAY NOT BE INTERESTED IN OPTIONS, BUT OPTIONS ARE INTERESTED IN YOU!
$SPX options make up 16% of the $SPX market cap!
Options gamma is one of the most significant structural flows within the equity markets.
Let's explore how it impacts your business.
Options are often linked to insurance.
And many times, rightfully so. They can help protect your portfolio when the sky is grey, and the rain washes down your hard-earned gains.
However, there's a key and vital difference.
Traditional insurance business typically uses diversification as a risk-management tool. The exposure to any single adverse event can be hedged by insuring other adverse events that fail to materialize. With enough uncorrelated bets, it's possible to achieve a positive return.
However, diversification isn't practical when hedging a book of $SPX options.
The primary risk-management technique is delta-hedging, which is when option traders start messing about in the equity markets.
And they are brutal.
They enter like a bull in a china shop, with complete disregard of price and value.
They have no respect for your market.
No appreciation of fundamentals.
No awareness of sector rotation.
No understanding of valuation multiples.
And on top of that - complete ignorance of the available liquidity!
They come.
They take what they need.
And they leave.
Frequently leaving the market perplexed and confused as to what just happened.
Investors are often left with no other choice but to come up with narratives that justify the aftermath of this inconsiderate behaviour.
But that's enough!
I say, no more!
It's time to...
Well, there isn't much we can do apart from trying to understand how and when these options traders impact the equity markets.
At least that way, we'll recognize when it happens, and we'll be prepared.
Ready?
First of all, I assure you that options market makers don't do that just to fuck with you - they have a good and solid reason to trade in your equity market.
In fact, they have no other choice.

They do their best to flatten the risk with other options, but the residual exposure is hedged with underlying shares or futures - a process known as delta hedging.
As the underlying moves, so does the delta-hedging requirement. Market makers are forced to trade the underlying simply due to the price of that asset changing and not for any other fundamental or economic reasons.
This creates a feedback loop, where the type and amount of options that investors trade influences the underlying price action. It would be equivalent if the act of buying fire insurance impacted the probability of a house burning down.
The amount of delta-hedging needed is mainly dependent on this thing called gamma.
And that's where the fun begins.
Gamma shows the potential amount of delta-hedging activity by the market makers. It's a source of one of the most significant structural flows in the equity markets.
These flows are non-discretionary (dealers have to hedge) and occur regardless of the available liquidity!
The importance of gamma increased over the last few years as the options market continued to grow and became a sizeable chunk of the underlying equity market.
At the moment, the $SPX options alone account for about 16% of the $SPX market cap. The total gross gamma outstanding is $8 billion, meaning that market makers need to trade approximately $8 billion worth of $SPX for a 1% move in the index.
Due to its nature, gamma can exacerbate market moves ("short gamma") or dampen them ("long gamma"). And this largely depends on how "the street" is positioned.
(The street == options market makers and dealers)
Long Gamma and Short Gamma
A quick rule of thumb - you are long gamma when you buy options and short gamma when you sell.
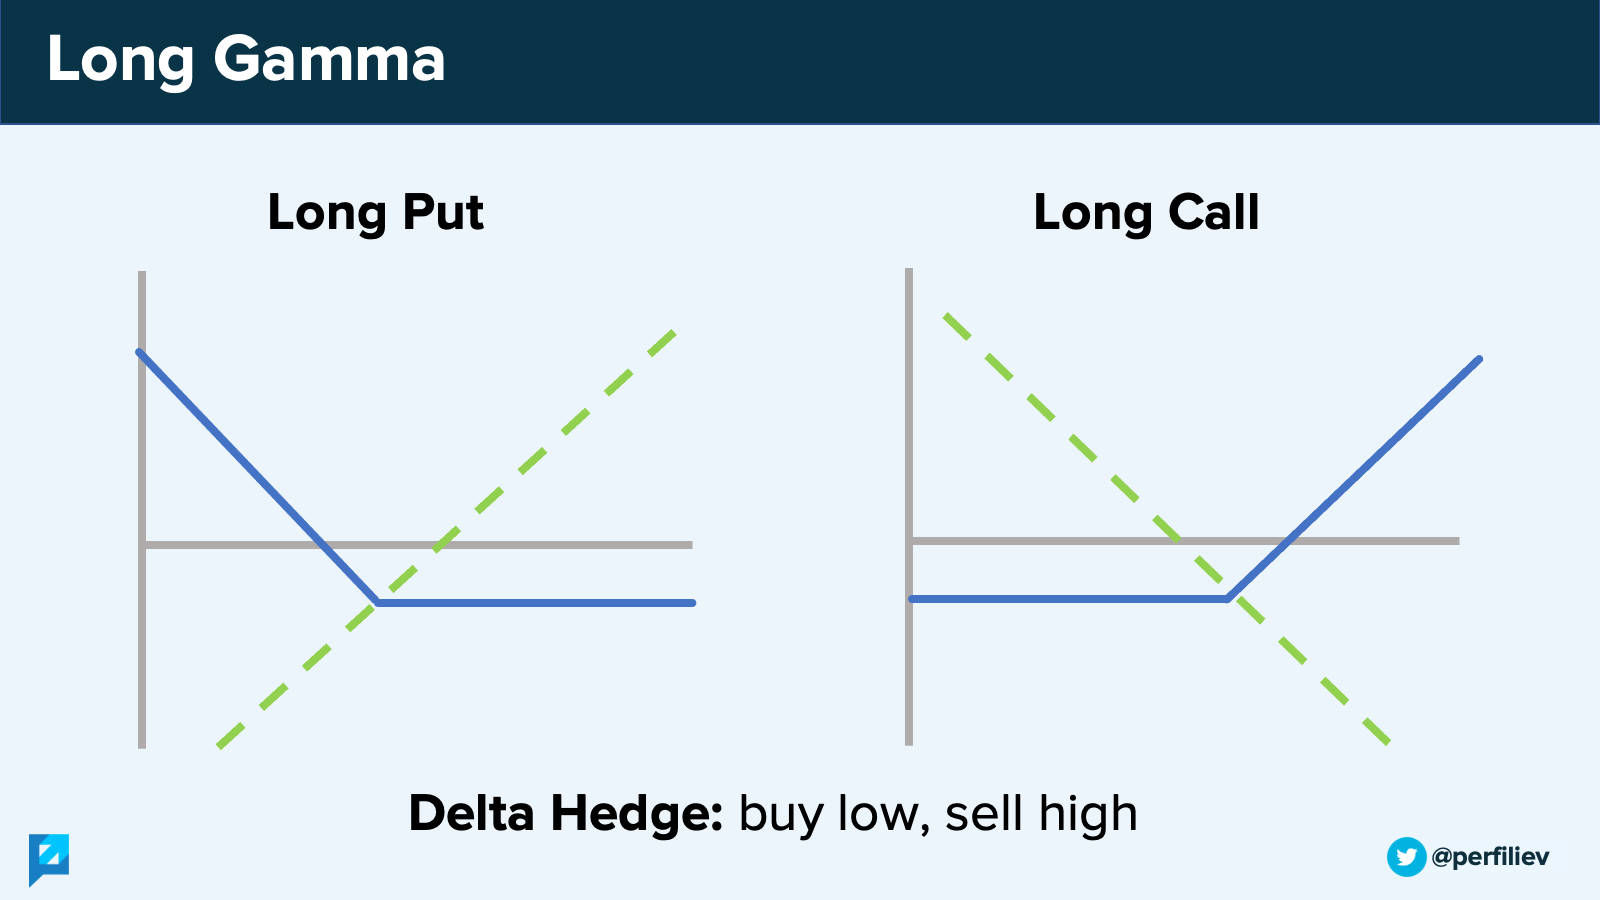
When the street is long gamma, that means option market makers net-net bought options. Their delta-hedging activity forces them to "buy low, sell high". They are sellers when the market rallies and buyers when it drops, conveniently adding liquidity and reducing volatility.
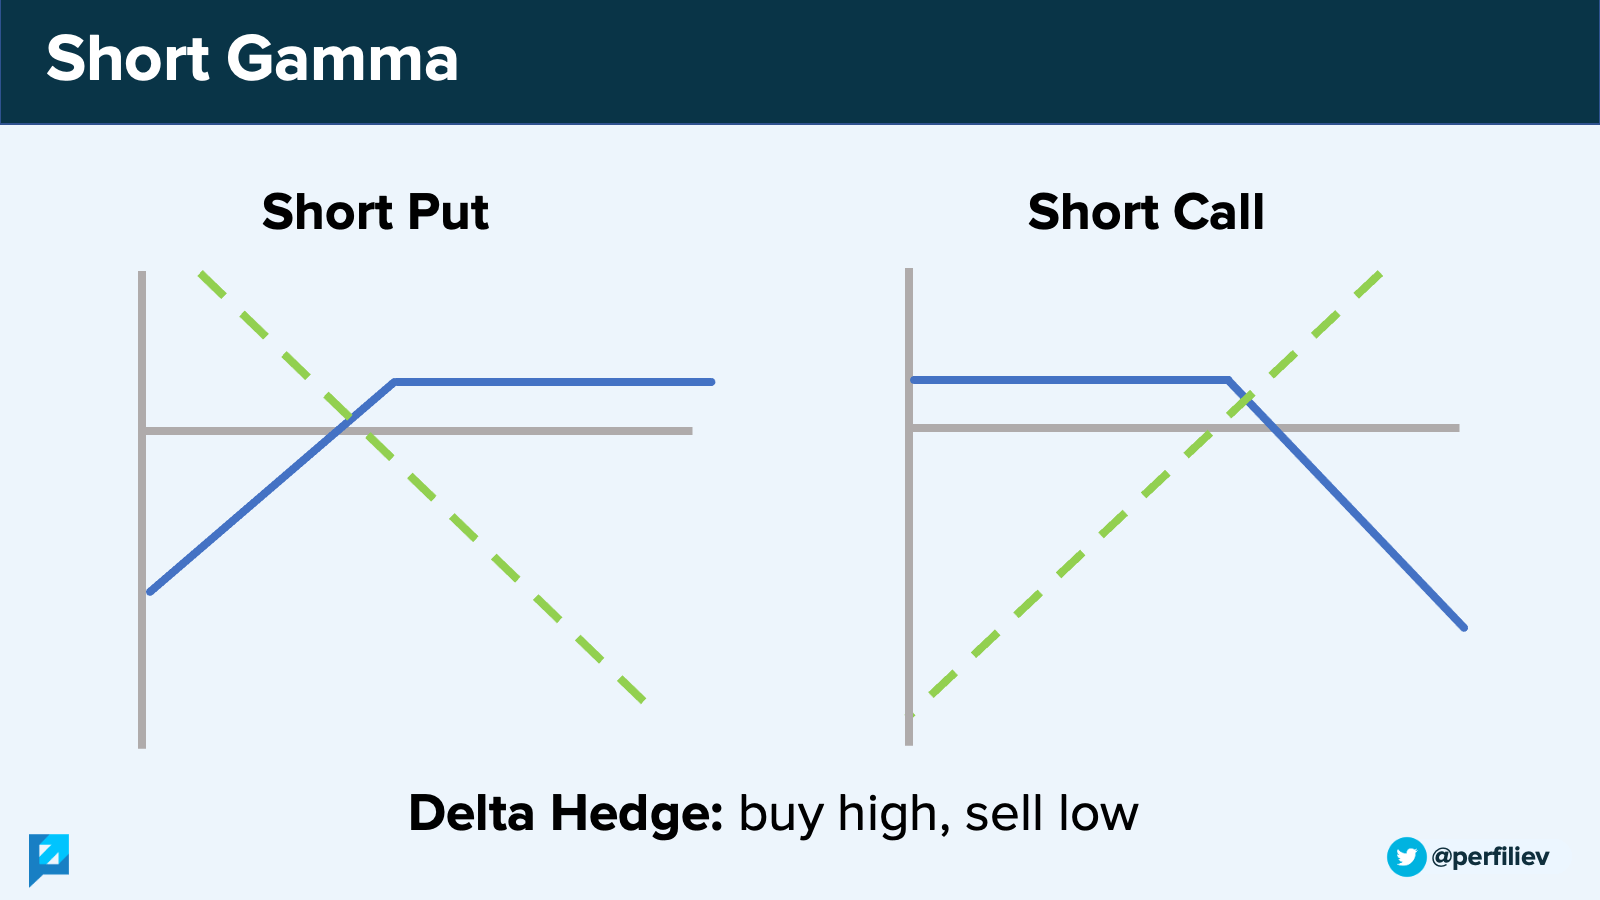
When the street is short gamma, the opposite happens. Dealers' book is short options, and they "buy high, sell low". This exacerbates market moves and removes liquidity (frequently, when it's needed the most).
So how is the street positioned?
Finding out net gamma positioning isn't a trivial task as it involves figuring out the direction of options trades.
However, an educated guess can help us approximate gamma exposure.
On an index level, it is generally believed that investors predominantly buy puts for protection and sell calls as part of overwriting strategies. This is evident in the $SPX skew, which shows higher implied volatility for puts than calls.
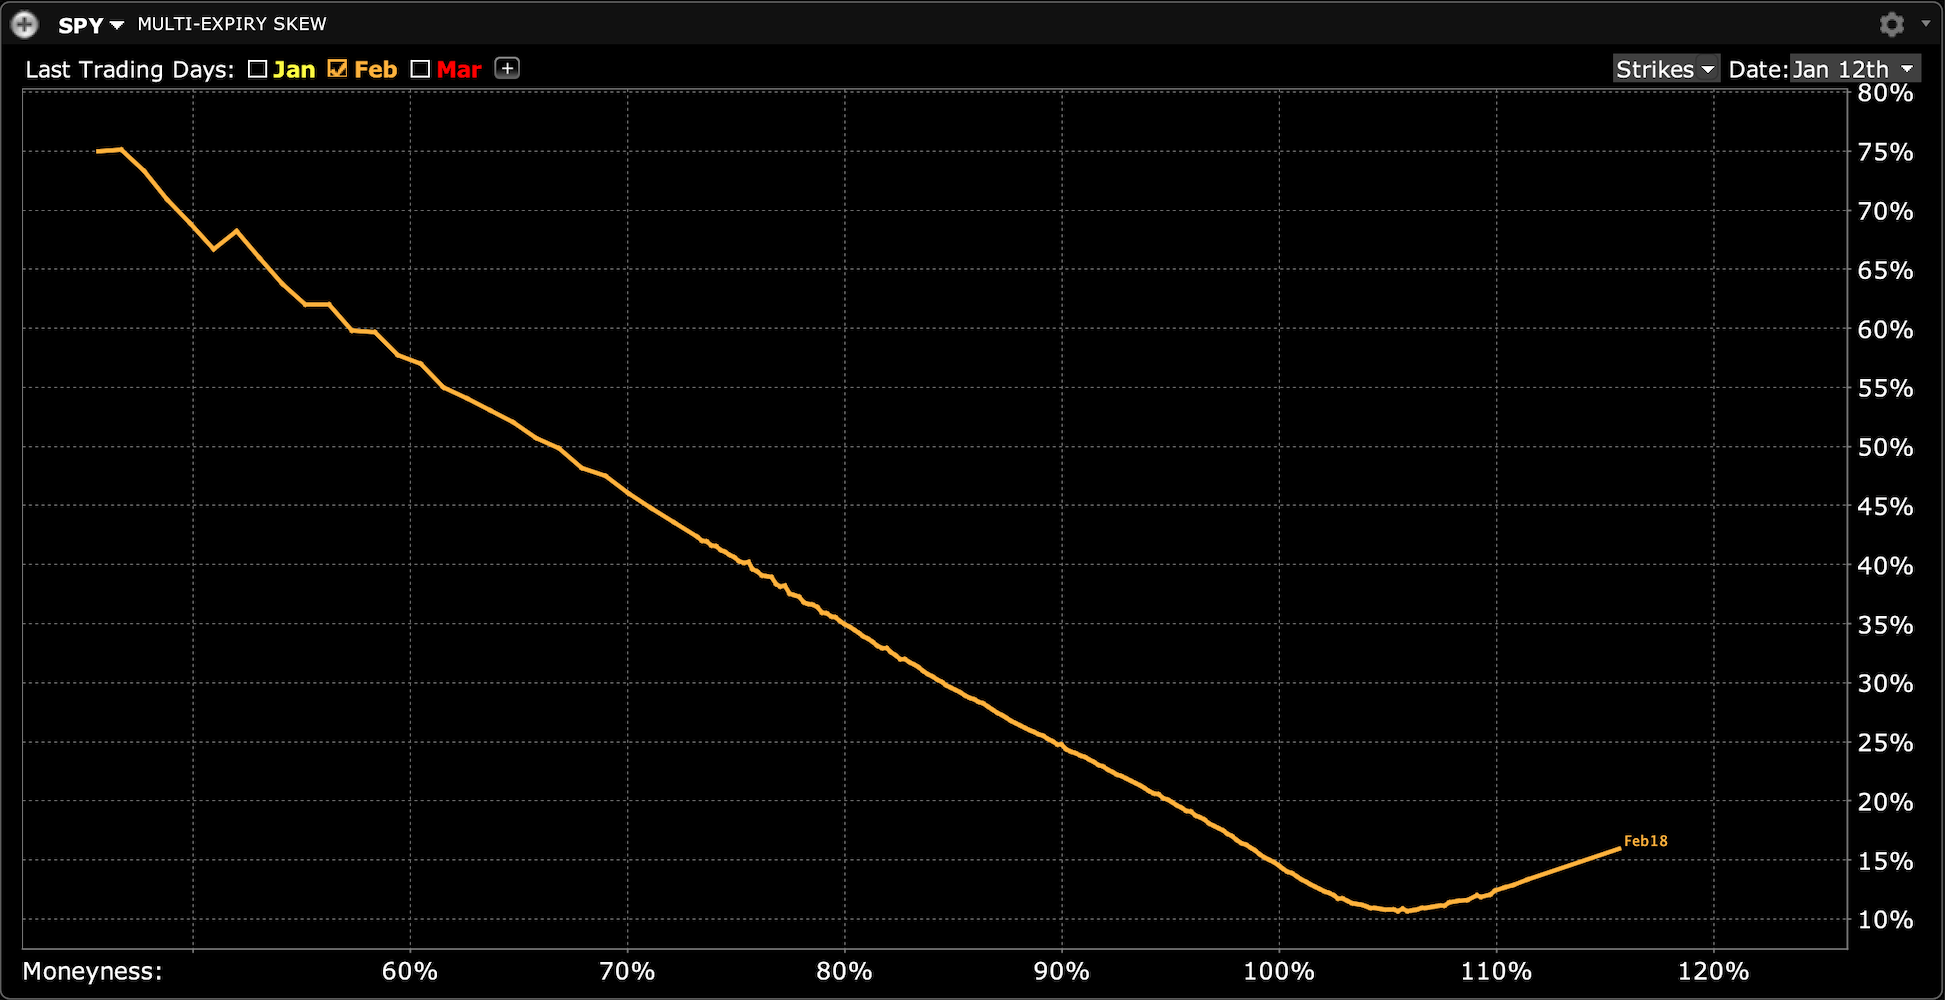
However, this can overestimate gamma as investors also sell puts for yield (structured products) and buy calls for leverage.
Still, under this assumption, puts carry negative gamma (not because they're puts, but because the street is short them), and calls carry positive gamma.
Hence the street is short gamma on the downside and long gamma on the upside.
A closely monitored data point is where the gamma is zero - known as the gamma flip. At the moment, this is around 4,660 for $SPX.
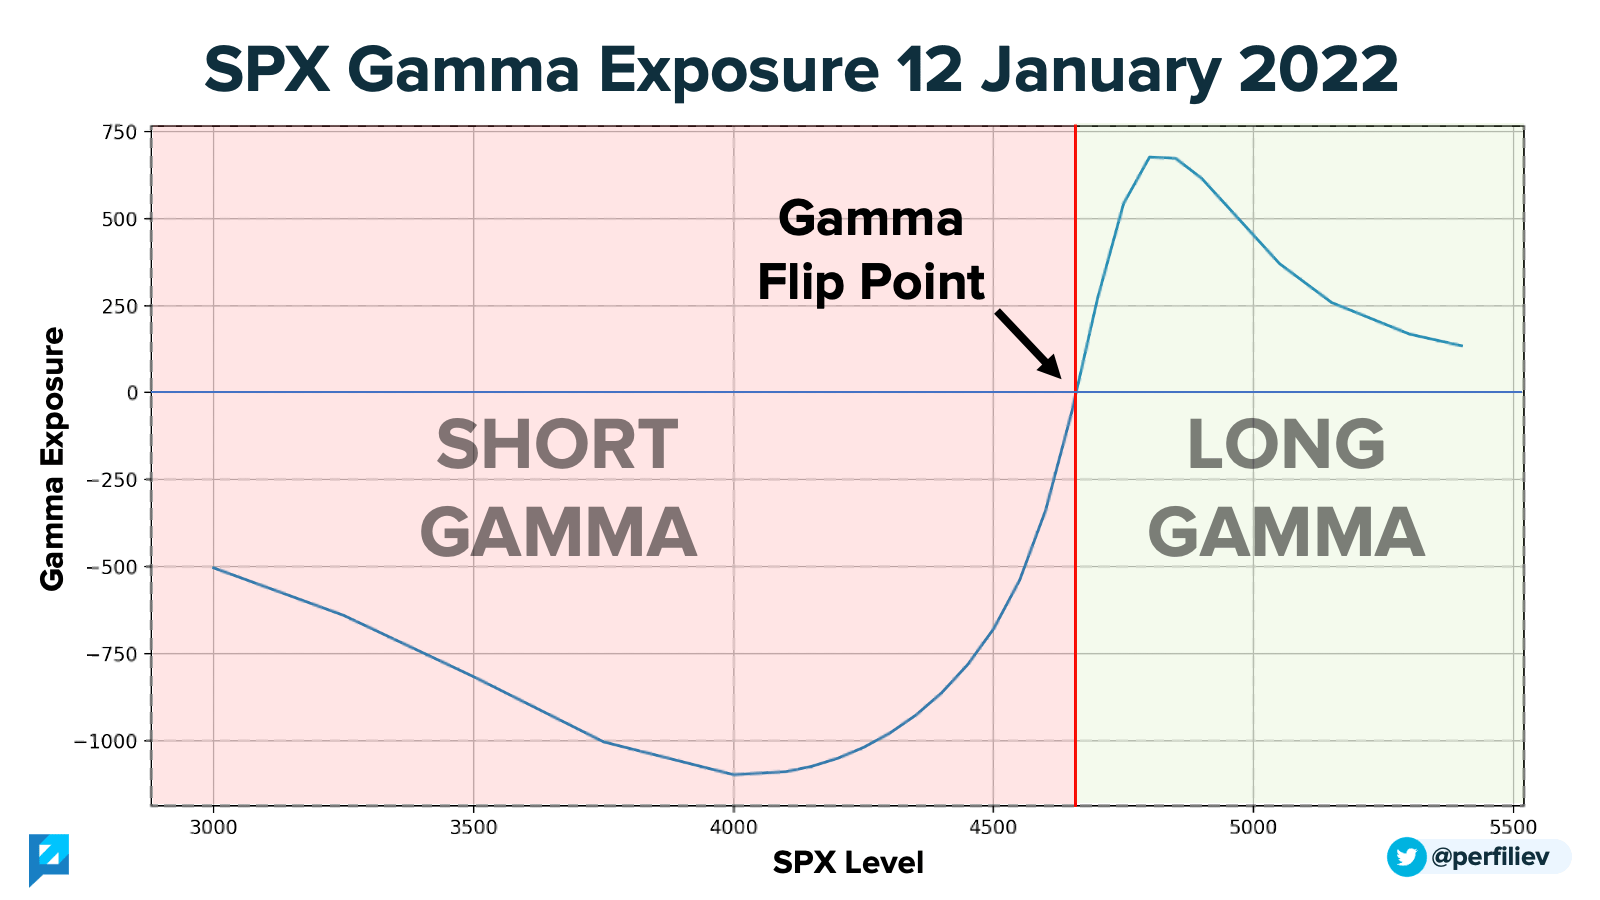
If we're above the gamma flip, the volatility tends to be low, as the market has to swim against the current of the options flow.
But should the market drop into negative gamma territory, expect fireworks.
In this scenario, delta-hedging flows move in the same direction as the market, potentially amplifying the price action. As volatility rises, systematic/managed volatility funds tend to cut exposure, further adding to the selling pressure and provoking more negative gamma flows.
When is Gamma the Strongest?
Of course, gamma is just one of the market forces here, and its impact largely depends on several factors, such as:
• Time to Expiry
• Open Interest
• Market Liquidity
• Volatility
For any single option, gamma is a bell-shaped curve centered around the strike. And it's the highest for short-dated, at-the-money (ATM) options:
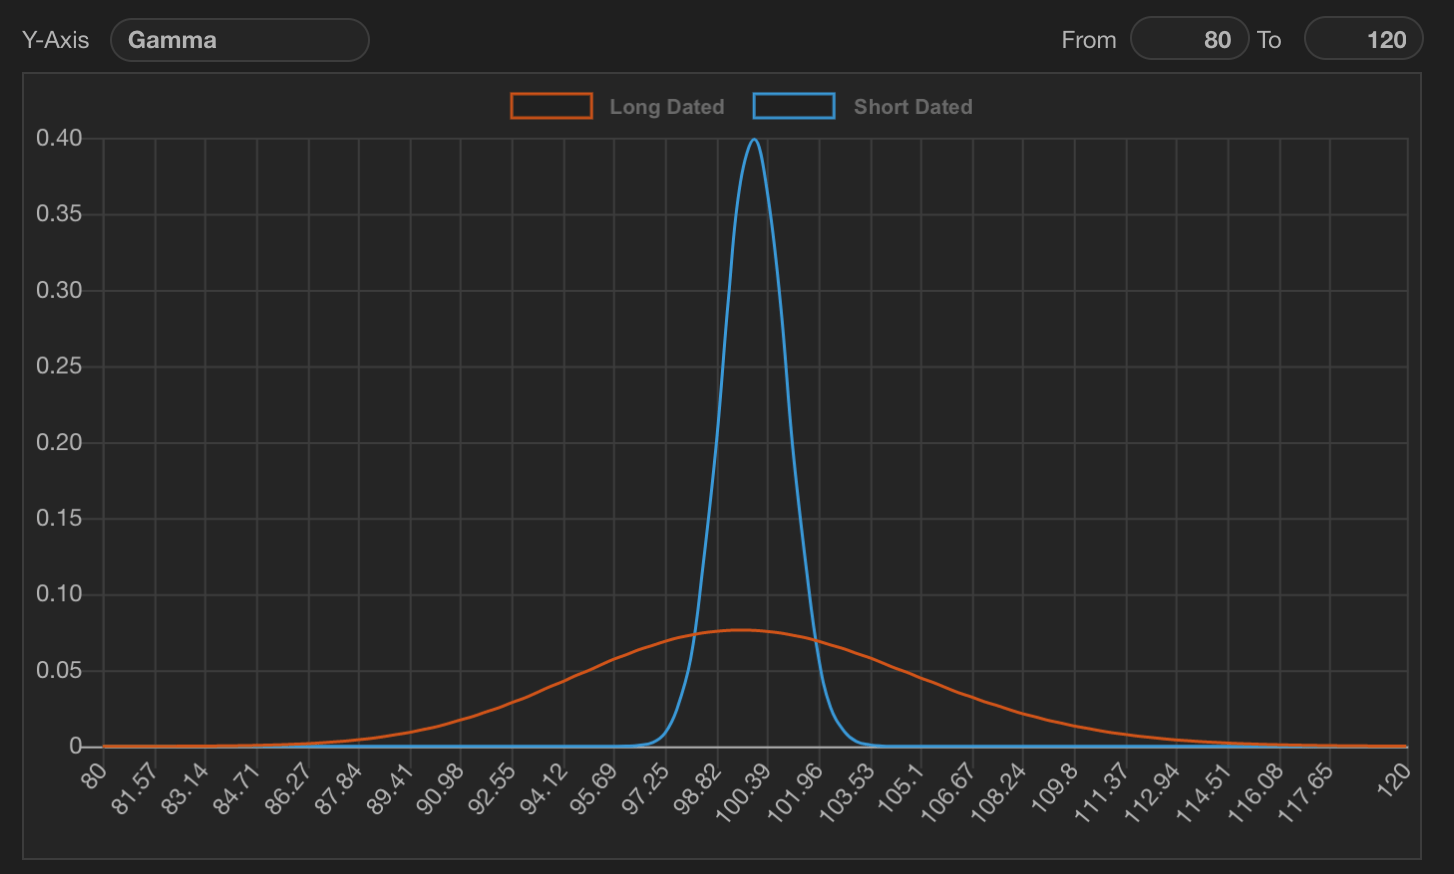
Hence, if the market is trading around a soon-to-expire strike with a high open interest, it's more likely that its gamma flows will impact the market.
The most open interest is frequently concentrated around large expiries and nice, round strikes:
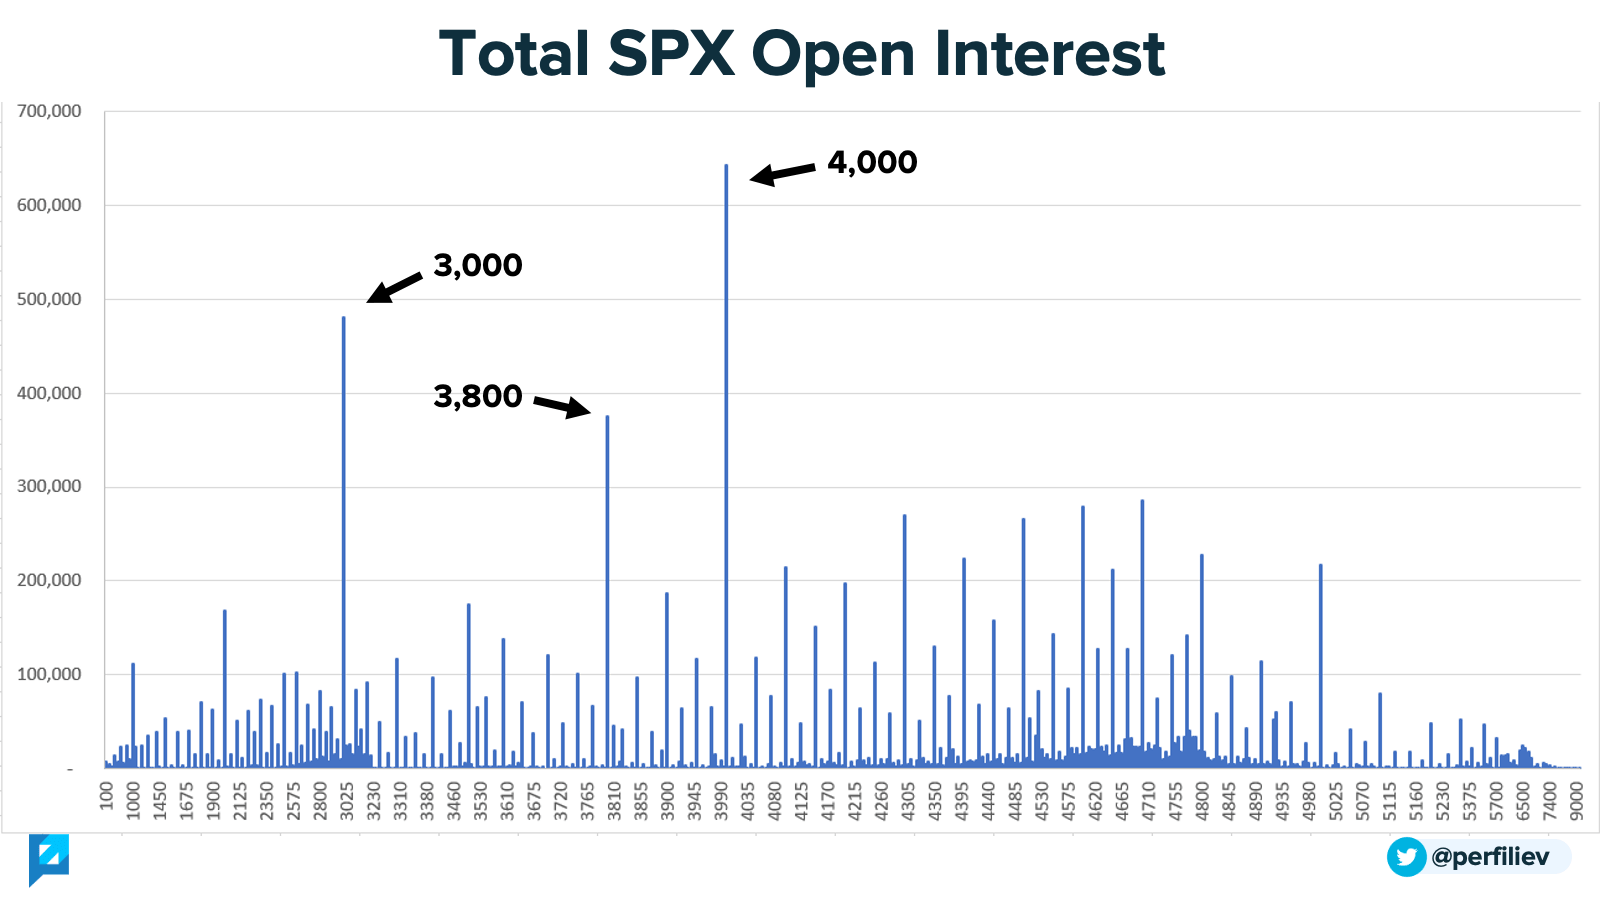
What do I mean by "large" expiries?
There is an $SPX options expiration every Mon, Wed and Fri, and traditional monthly options expire every third Friday of the month. However, longer maturities tend to be listed on a quarterly (Mar/Jun/Sep/Dec) and yearly (Dec) basis only. For example, currently, only December expiries are listed beyond June 2023.
Since these maturities have been around for longer, they accumulate a considerable open interest. Quarterly third Friday options also have an added benefit of $SPX futures expiring on the same date. Delta-hedging and unwinding these positions can increase market activity around the expiration time.
However, are these flows strong enough to move the market?
Well, that depends on the available liquidity at the time. The higher the liquidity, the more likely the market will simply absorb any delta-hedging flows without even noticing it.
However, at times of low liquidity, gamma flows can be responsible for significant price action around options expirations.
Is there anything that can stop gamma and its evil plans?
Yes, gamma tends to lose its powers in a high vol environment, as delta becomes less sensitive to underlying moves. This is because short-dated options behave as longer-dated in a high vol environment.
Their gamma isn't concentrated around the strike but is spread around a broader range of underlying prices. When this happens, it becomes essential to look at delta changes with respect to volatility instead, which we'll explore in our future posts.
For details on how to calculate dealer gamma exposure, please check out this post about it: How To Calculate Gamma Exposure and Zero Gamma Level
Thank you so much for taking the time to read this! I sincerely hope you found it interesting and valuable.
Follow me on Twitter (https://twitter.com/perfiliev) for more educational threads around stocks, options and other topics within the incredible world of financial markets.


